
DOCS
Quickstart
- Upload one or more baseline files — SQL/PL-SQL source, a DBMS_XPLAN execution plan export, an AWR/TKPROF report, or an Oracle dump — into the baseline panel.
- Upload the matching current files from the run you're investigating into the current panel. Multiple files of the same type are paired by filename, then by position.
- Click
Analyze. OraTune parses both sides, computes the diff and plan comparison, and runs the findings engine — plus your configured AI provider, if one is set. - Review the four result tabs —
Code Diff,Execution Plans,Findings, andRecommendations. See Reading your results for what each one shows. - Export the report from
File > Export Report. It saves a single self-contained HTML file with the findings, plan comparison, diff statistics, and recommendations.
Supported file types
| Category | Extensions | What OraTune reads |
|---|---|---|
| SQL and PL/SQL source | .sql, .pls, .pks, .pkb, .prc, .fnc, .trg | Statement type, referenced object names, hints (/*+ ... */), and index names referenced in those hints; diffed line-by-line and structurally between baseline and current. |
| Performance and diagnostic reports | .txt, .lst, .html, .htm, .xml | AWR text or HTML reports and TKPROF listings — DB time, elapsed time, wait events, and top SQL. .xml files are DBMS_XPLAN execution-plan exports. |
| Data Pump dump | .dmp (binary magic bytes) | OraTune extracts readable strings and structured fields — schema, table, and index names, the source Oracle version, character set, and embedded SQL fragments. It does not import or restore the dump. |
| ADR trace / diagnostic dump | .dmp (rename a .trc file before uploading; detected by SESSION ID, ORA-, or DUMP FILE markers) | ORA- errors, wait events, elapsed time, and embedded execution plans extracted from the trace text. |
| SQL*Plus spool | .dmp (text fallback when no other format matches) | SQL statements, SET TIMING elapsed values, row counts, and AUTOTRACE statistics extracted from the spooled session text. |
| SQLT / SQLTXPLAIN | .dmp (detected by SQLTXPLAIN or TOOL: SQLT markers) | Optimizer parameters, table and index statistics, clustering factors, histograms, and bind variables extracted from the SQLT output. |
Reading your results
When analysis finishes, the results land in four tabs, each covering a different facet of the comparison.
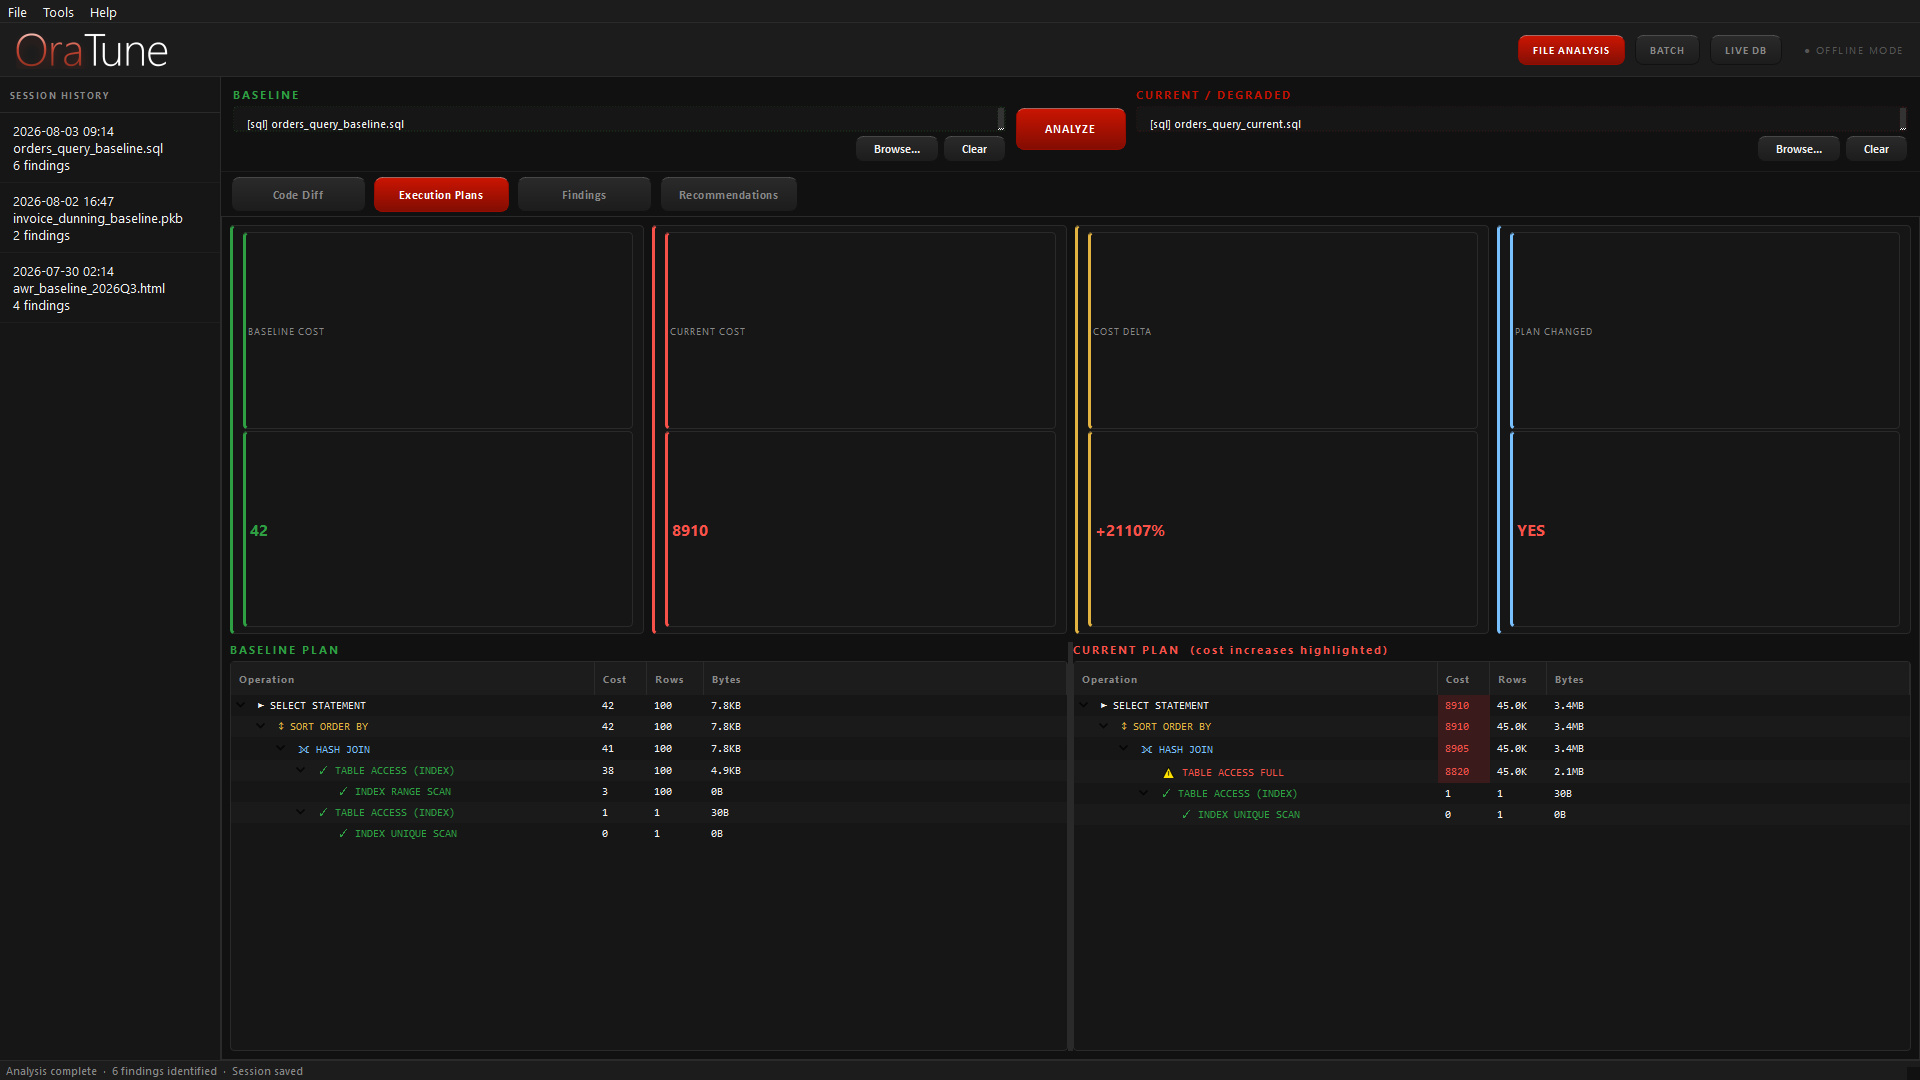
- Code Diff — syntax-highlighted baseline-vs-current SQL. Changed, added, and removed lines are colour-coded; structural changes such as hint or index-hint additions and removals are listed beneath, with a similarity ratio and add, remove, and change counts.
- Execution Plans — the two plan trees side by side, with cost and cardinality at each node. Full-scan regressions, index changes, join-method changes, and new sort operations are called out, along with a total-cost delta and a plan-shape-changed flag.
- Findings — every issue as a severity-sorted card. Click any
ORA-XXXXXcode to open its reference entry. - Recommendations — root-cause analysis and numbered remediation, from your AI provider or the offline engine, rendered as Markdown.
Severity levels
Every finding carries one severity. The app also colour-codes them; the label is the source of truth.
| Severity | Meaning |
|---|---|
| CRITICAL | Severe regression; act immediately. |
| HIGH | Significant regression; address promptly. |
| MEDIUM | Moderate issue; investigate and plan a fix. |
| LOW | Minor issue; low urgency. |
| INFO | Informational; no action needed. |
Exported report
File > Export Report writes a single self-contained HTML file — all findings, the plan-comparison summary, code-diff statistics, and recommendations — with no external CSS or JavaScript. It is portable enough to attach to a change ticket.
Batch analysis
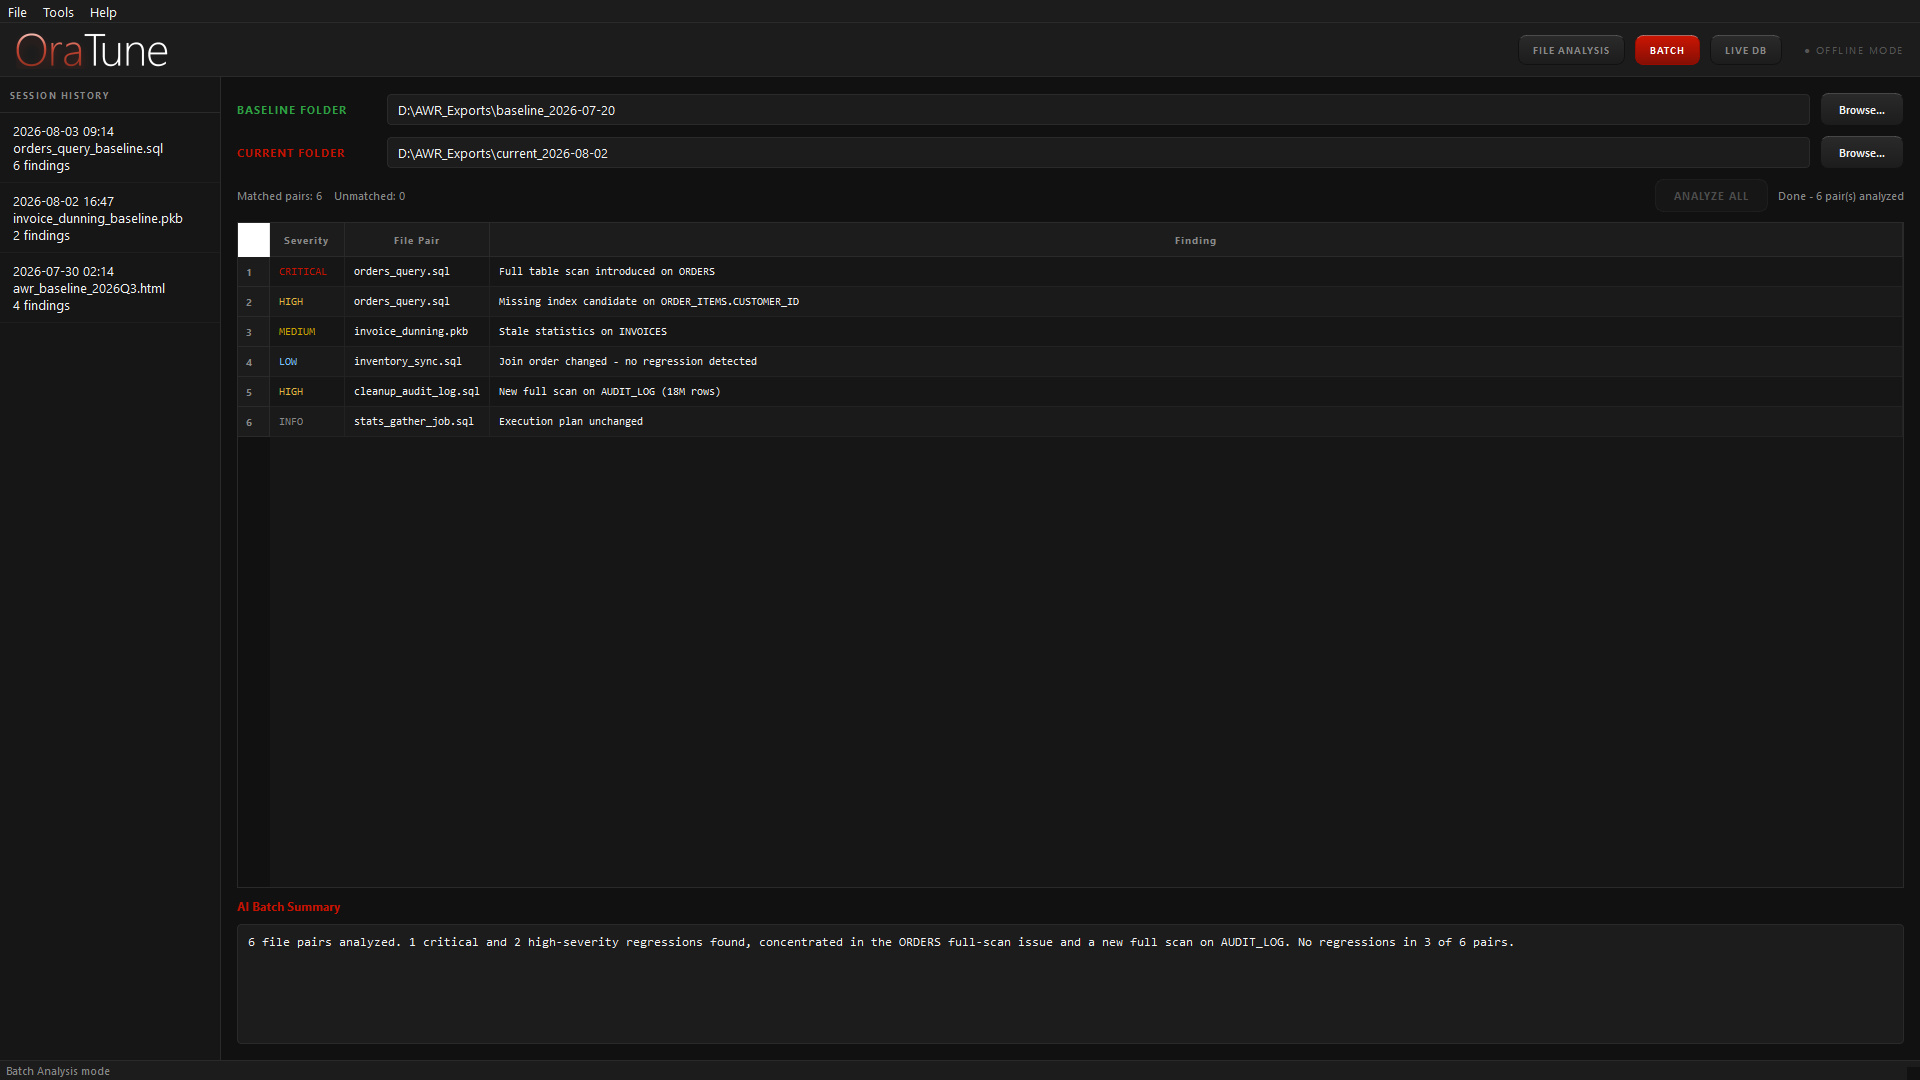
Batch analysis compares many file pairs in one run. Switch to the Batch tab, set a baseline folder and a current folder, and click Run Batch.
- Pairing — files are matched by exact filename across the two folders (case-sensitive).
report_q1.sqlin both folders is one pair. Name files consistently or they will not pair. - Type — each pair is classified by extension and analysed as the matching single-pair type. Only recognised extensions are considered — the SQL/PL/SQL set,
.xmlplans,.txt/.lst/.html/.htmreports, and.dmpdumps. - Unmatched files — anything present in only one folder is listed in the results but not analysed. Review that list for naming mismatches.
- Results — one row per pair with its highest-severity finding; click a row for that pair's full findings log. When an AI provider is configured, a summary paragraph closes the run.
Live database mode
Live DB mode connects OraTune to a running instance for real-time diagnostics. Click Connect in the Live DB tab and enter connection details.
- Connection dialog — two connection types:
- Direct: Host, Port (default 1521), Service Name, Username, Password.
- TNS: TNS Alias, Username, Password.
Test Connectionopens and immediately closes a connection to validate the credentials, without disturbing the active session.
Least-privilege connection
Grant only what the tabs you use require.
| Feature | Required privileges |
|---|---|
| Top SQL (AWR) | SELECT on DBA_HIST_SQLSTAT, DBA_HIST_SNAPSHOT, DBA_HIST_SQLTEXT |
| Top SQL (V$SQL fallback) | SELECT on V$SQL |
| AWR Trends | SELECT on DBA_HIST_SQLSTAT, DBA_HIST_SNAPSHOT, V$DATABASE |
| Explain Plan | CREATE ANY TABLE or access to PLAN_TABLE; EXECUTE on DBMS_XPLAN |
| Index Advisor | SELECT on DBA_INDEXES, DBA_INDEX_USAGE, DBA_HIST_SQL_PLAN, DBA_HIST_SQLSTAT, DBA_TABLES, V$DATABASE |
| Stats Health | SELECT on DBA_TAB_STATISTICS, DBA_TABLES, DBA_TAB_PARTITIONS, SYS.AUX_STATS$ |
| Plan Baselines | SELECT on DBA_SQL_PLAN_BASELINES; EXECUTE on DBMS_SPM |
| Scheduler | SELECT on DBA_SCHEDULER_JOBS, DBA_SCHEDULER_JOB_RUN_DETAILS, DBA_SCHEDULER_PROGRAMS, DBA_SCHEDULER_SCHEDULES; EXECUTE on DBMS_SCHEDULER |
Every tab needs only SELECT on the views it queries. Plan Baselines and Scheduler additionally require EXECUTE on DBMS_SPM or DBMS_SCHEDULER — those grants let OraTune alter, drop, or run jobs from inside the app, so restrict them to a connection you trust with that control.
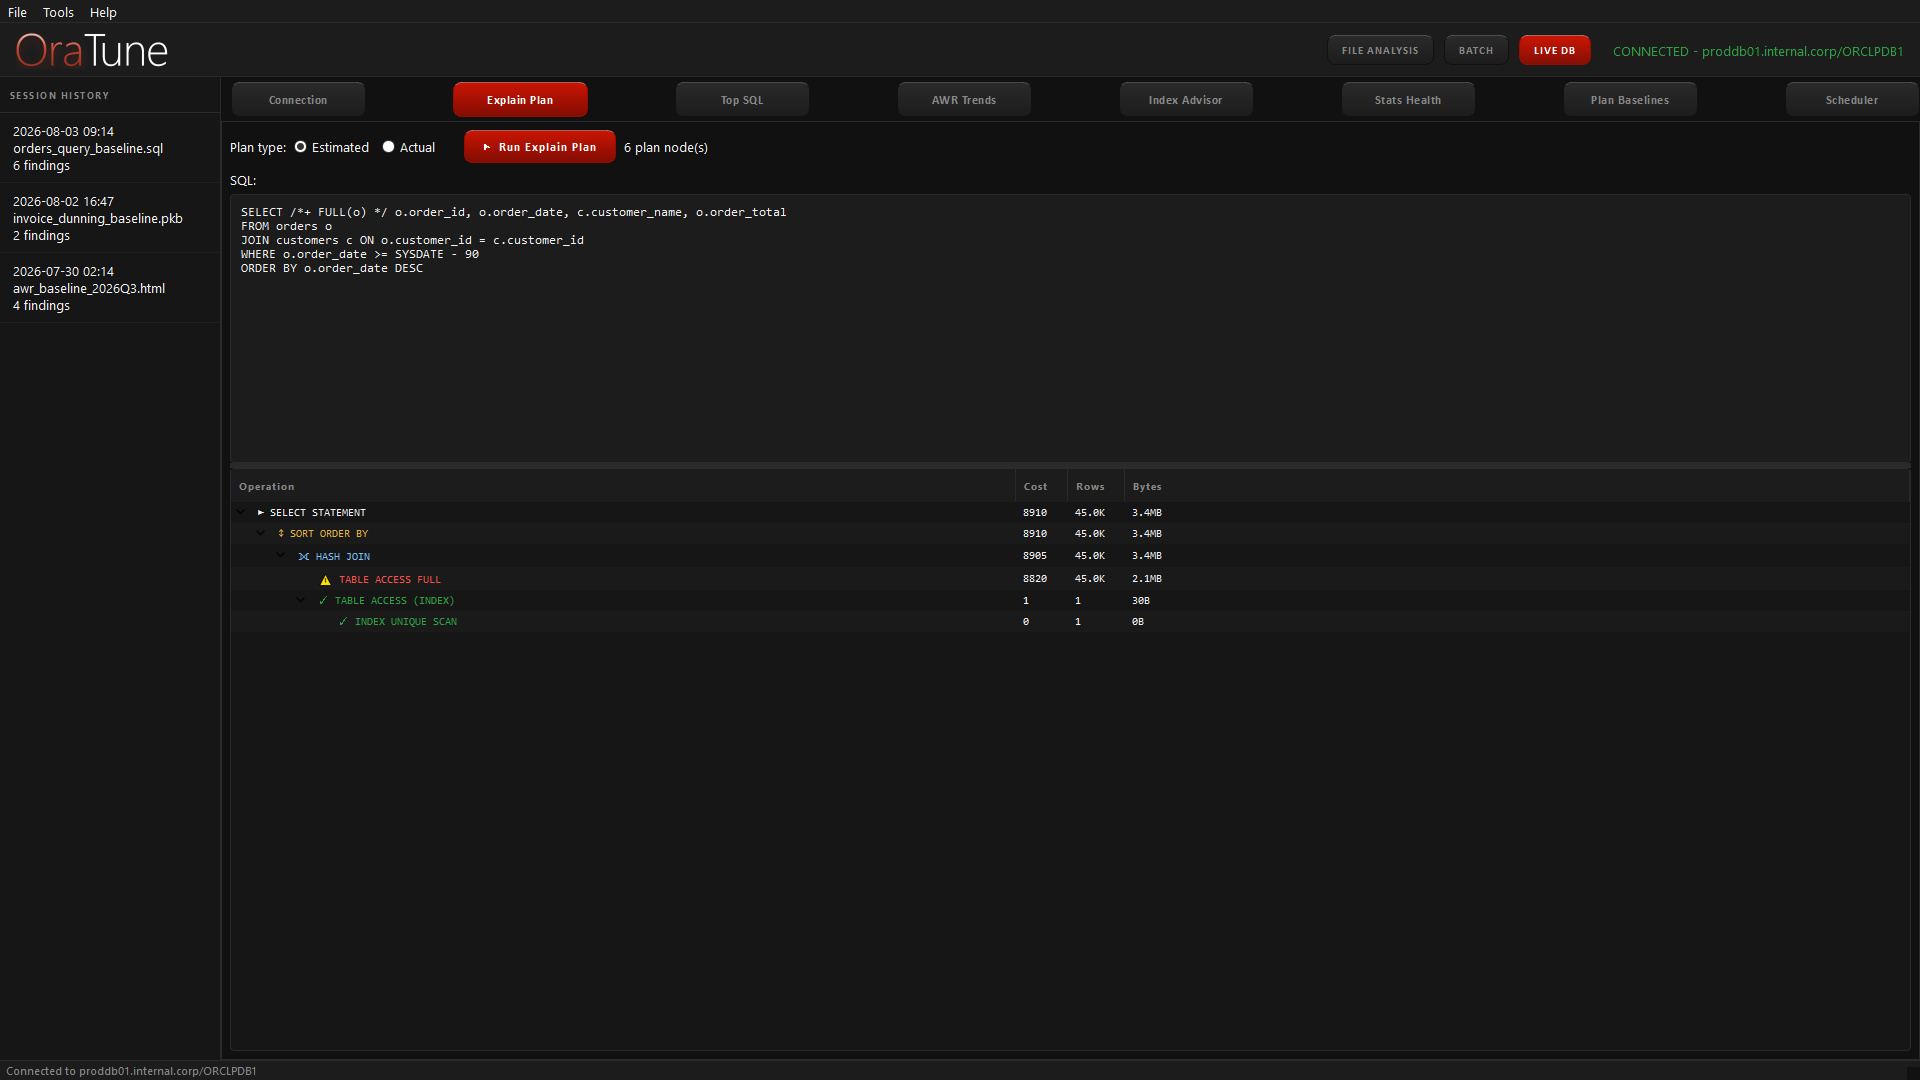
Estimated vs actual plans
The Explain Plan tab runs one of two ways. Estimated runs EXPLAIN PLAN and reads it back with DBMS_XPLAN.DISPLAY — the statement is not executed. Actual runs the statement with a gather_plan_statistics hint and reads real row counts with DISPLAY_CURSOR. Because Actual mode executes the statement, do not run it against a query that performs DML. Bind variables (:name) are set to NULL so the statement plans without values.
Stats Health checks
The Stats Health tab runs five checks against optimizer statistics — stale, missing (NUM_ROWS null), locked, un-analysed partitions, and system statistics. Each result carries a severity and can be filtered by schema.
For what every Live DB tab does, see Features.
ORA- error reference
OraTune bundles an offline reference for 225+ ORA- error codes — no internet connection needed.
- Open it from
Tools > ORA- Error Reference(Ctrl+Shift+O), or click anyORA-XXXXXcode shown in the Findings tab to jump straight to that entry. - Each entry carries the message template, the cause, and the recommended action.
- Search matches across code, message, and cause at once (case-insensitive) and filters as you type. An empty search lists every entry.
AI recommendations
The Recommendations tab works with no configuration: a deterministic offline rules engine ships findings with Oracle-specific remediation on its own.
- Optional providers — add an API key in
Tools > Settingsto use Claude, OpenAI, Azure OpenAI, or GitHub Copilot for root-cause narratives instead. Claude is the default. - What leaves your machine — with a provider enabled, OraTune sends a summary of the analysis to that provider's API. Nothing is sent when the offline engine is used. For exactly what the summary contains, see the FAQ.
- Where keys live — Windows Credential Manager, under the service name
OraTune, one entry per provider — never the settings file. If no secure store is available, OraTune leaves the key unset rather than writing plaintext. Keys can also be supplied by environment variable:ANTHROPIC_API_KEY,OPENAI_API_KEY,AZURE_OPENAI_API_KEY,GITHUB_COPILOT_TOKEN.
Tips
- Upload matching artifacts on each side — baseline SQL with current SQL, baseline plan with current plan.
- For execution plans, generate with
SELECT * FROM TABLE(DBMS_XPLAN.DISPLAY_CURSOR(sql_id => 'YOUR_SQL_ID', format => 'ALL ALLSTATS LAST')). - For TKPROF, upload the raw
.lstor.txtfrom thetkprofutility, not the spooled session log. - For ADR traces, rename the
.trcfile to.dmpbefore uploading. - AI recommendations are sharpest when you provide both the SQL and an execution plan — the plan comparison gives precise context for what changed.
- The offline engine handles common regressions — stale statistics, index changes — well without any key.
- Batch: name files identically across folders so they pair, and review the unmatched list after the run.
- Live DB: if Oracle Client is installed, thick mode activates automatically and covers older Oracle versions that thin mode does not.
Troubleshooting
| Symptom | Likely cause | Resolution |
|---|---|---|
| ORA-01017 on connect | Wrong username or password | Verify credentials; check the Oracle authentication mode. |
| ORA-12541 on connect | Listener not running, or wrong host/port | Check the TNS listener; verify host, port, and service name. |
| Explain Plan gives ORA-00905 | Statement is not DML | Only SELECT, INSERT, UPDATE, DELETE, and MERGE work with EXPLAIN PLAN. |
| Explain Plan (Actual) gives ORA-01008 | Non-standard bind syntax | OraTune replaces :binds with NULL automatically; check for unusual bind syntax. |
| Top SQL shows 0 rows (AWR path) | No SELECT on DBA_HIST_* views, or no AWR data in range | Grant the DBA_HIST privileges or widen the time range; the V$SQL fallback is used automatically. |
| Stats Health shows all critical | No SELECT on DBA_TAB_STATISTICS | GRANT SELECT ON DBA_TAB_STATISTICS TO <user> |
| Plan Baselines empty | No baselines in DBA_SQL_PLAN_BASELINES, or no access | Check OPTIMIZER_USE_SQL_PLAN_BASELINES; verify the SELECT privilege. |
| Recommendations show offline content | No API key configured, or the provider call failed | Add a key in Tools > Settings; check the error detail in the recommendation panel. |
| Application crashes on startup | PyQt6-Charts DLL path issue on Windows | Ensure PyQt6-Charts is installed; OraTune adds the Qt bin directory to the DLL search path at launch. |
Still stuck? Contact us.
FAQ
Does my SQL leave my machine?
No, not by default. OraTune's offline rules engine runs entirely on your machine. If you enable an AI provider (Claude, ChatGPT, Azure OpenAI, or GitHub Copilot) in Settings, a summary of the analysis — findings, plan-comparison metrics, SQL diff statistics, and relevant excerpts from AWR/TKPROF/dump data — is sent to that provider's API to generate recommendations.
Which Oracle versions are supported?
OraTune connects via python-oracledb, defaulting to thin mode (no Oracle Client required). If Oracle Client libraries are installed, OraTune switches to thick mode automatically, which respects server-side sqlnet.ora settings and extends support to older Oracle versions that thin mode does not cover.
Data Pump dumps are binary — what can OraTune read?
OraTune detects a Data Pump file by its binary magic bytes and extracts readable strings and structured fields from it — schema, table, and index names, the source Oracle version, character set, and embedded SQL fragments — rather than importing the dump. For readable DDL/SQL instead of a binary extract, generate a SQL file from the dump with Oracle's own impdp ... SQLFILE= option and upload that file to OraTune as a SQL source file.
Where are my API keys stored?
In Windows Credential Manager, under the service name OraTune, one entry per provider. Keys are never written to the settings file; if no secure credential store is available on the machine, OraTune leaves the key unset rather than falling back to a plaintext file.