SQL / PLSQL Diff

Side-by-side, syntax-highlighted comparison with structural change detection. See the exact clause that changed.

Reads all seven SQL and PL/SQL source types — .sql, .pls, .pks, .pkb, .prc, .fnc, .trg — on both sides, normalizes line endings, and computes a line-level and structural diff. Changed, added, and removed lines are colour-coded, and structural changes such as hint or index-hint additions and removals are listed beneath. A similarity ratio and add, remove, and change counts quantify how far the two versions drifted.
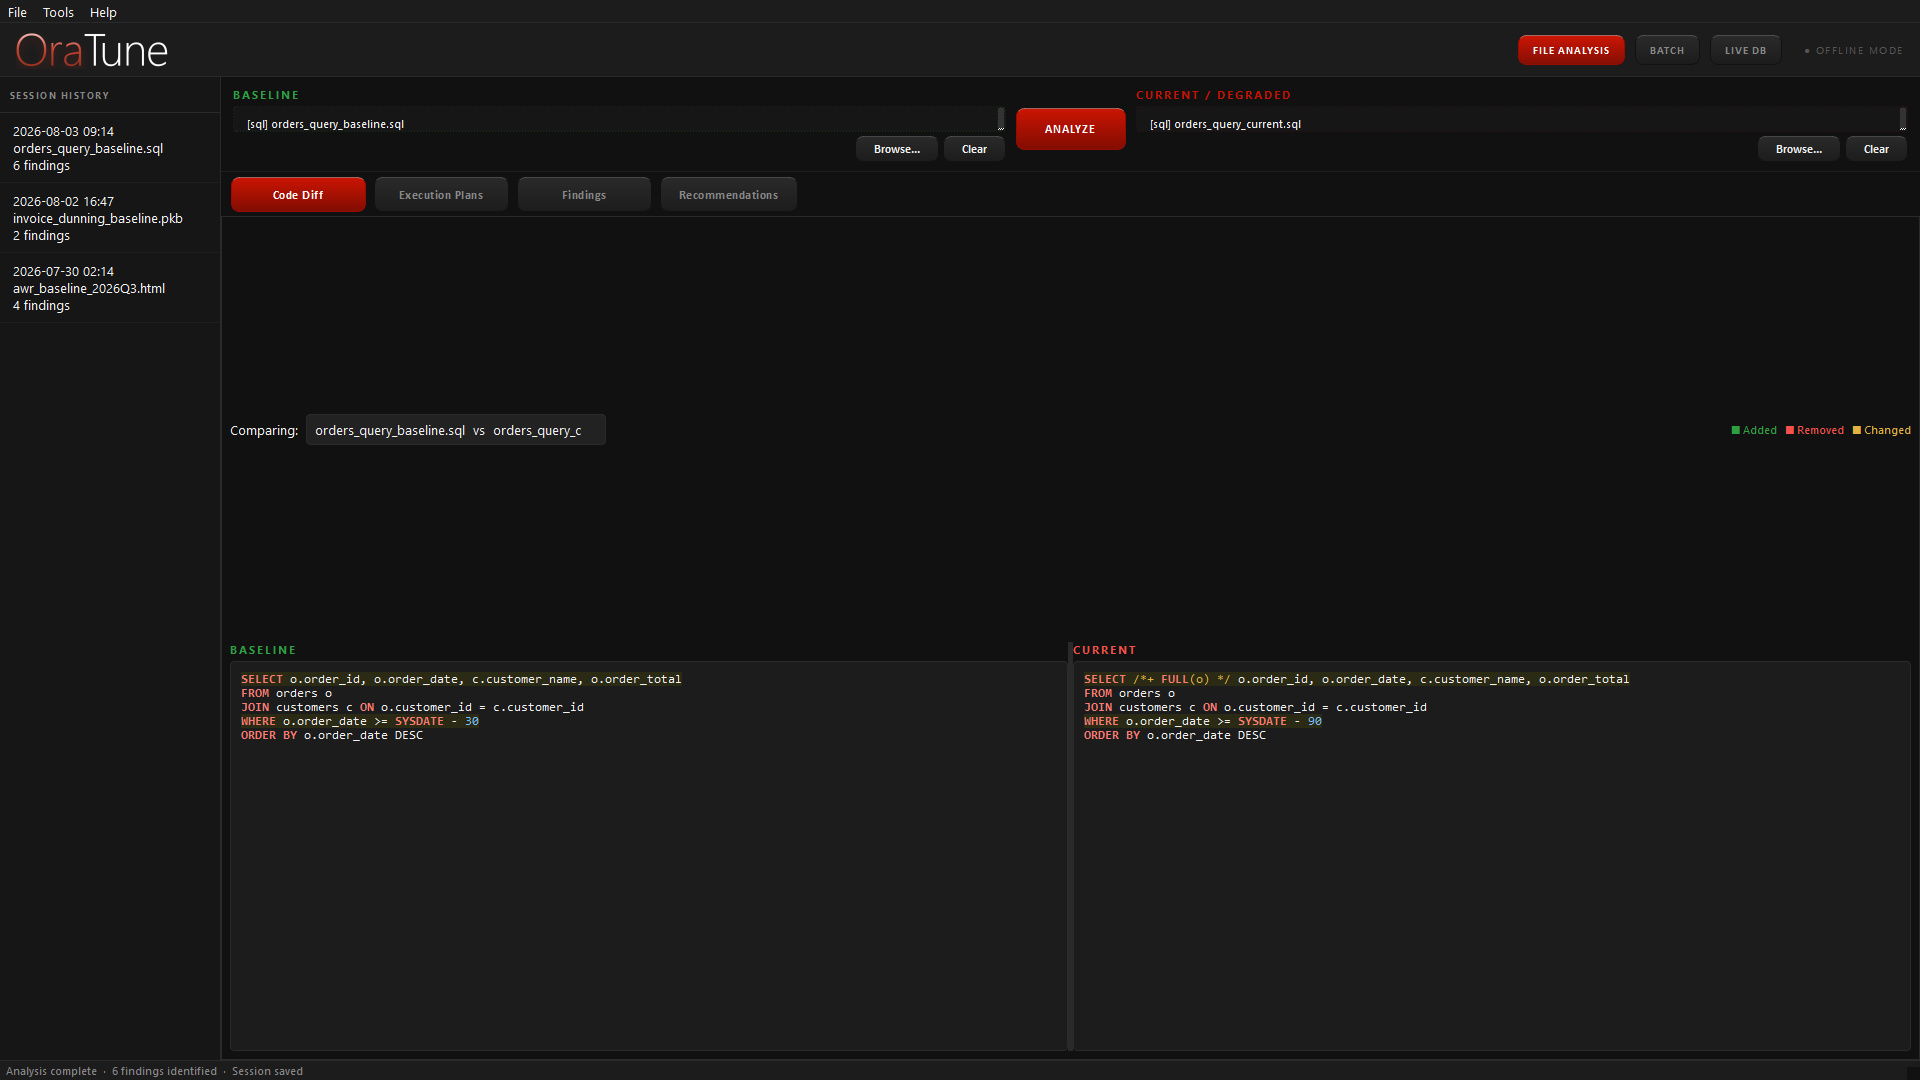
OraTune Code Diff view: a baseline and current SQL statement shown side by side.

Execution Plan Comparison

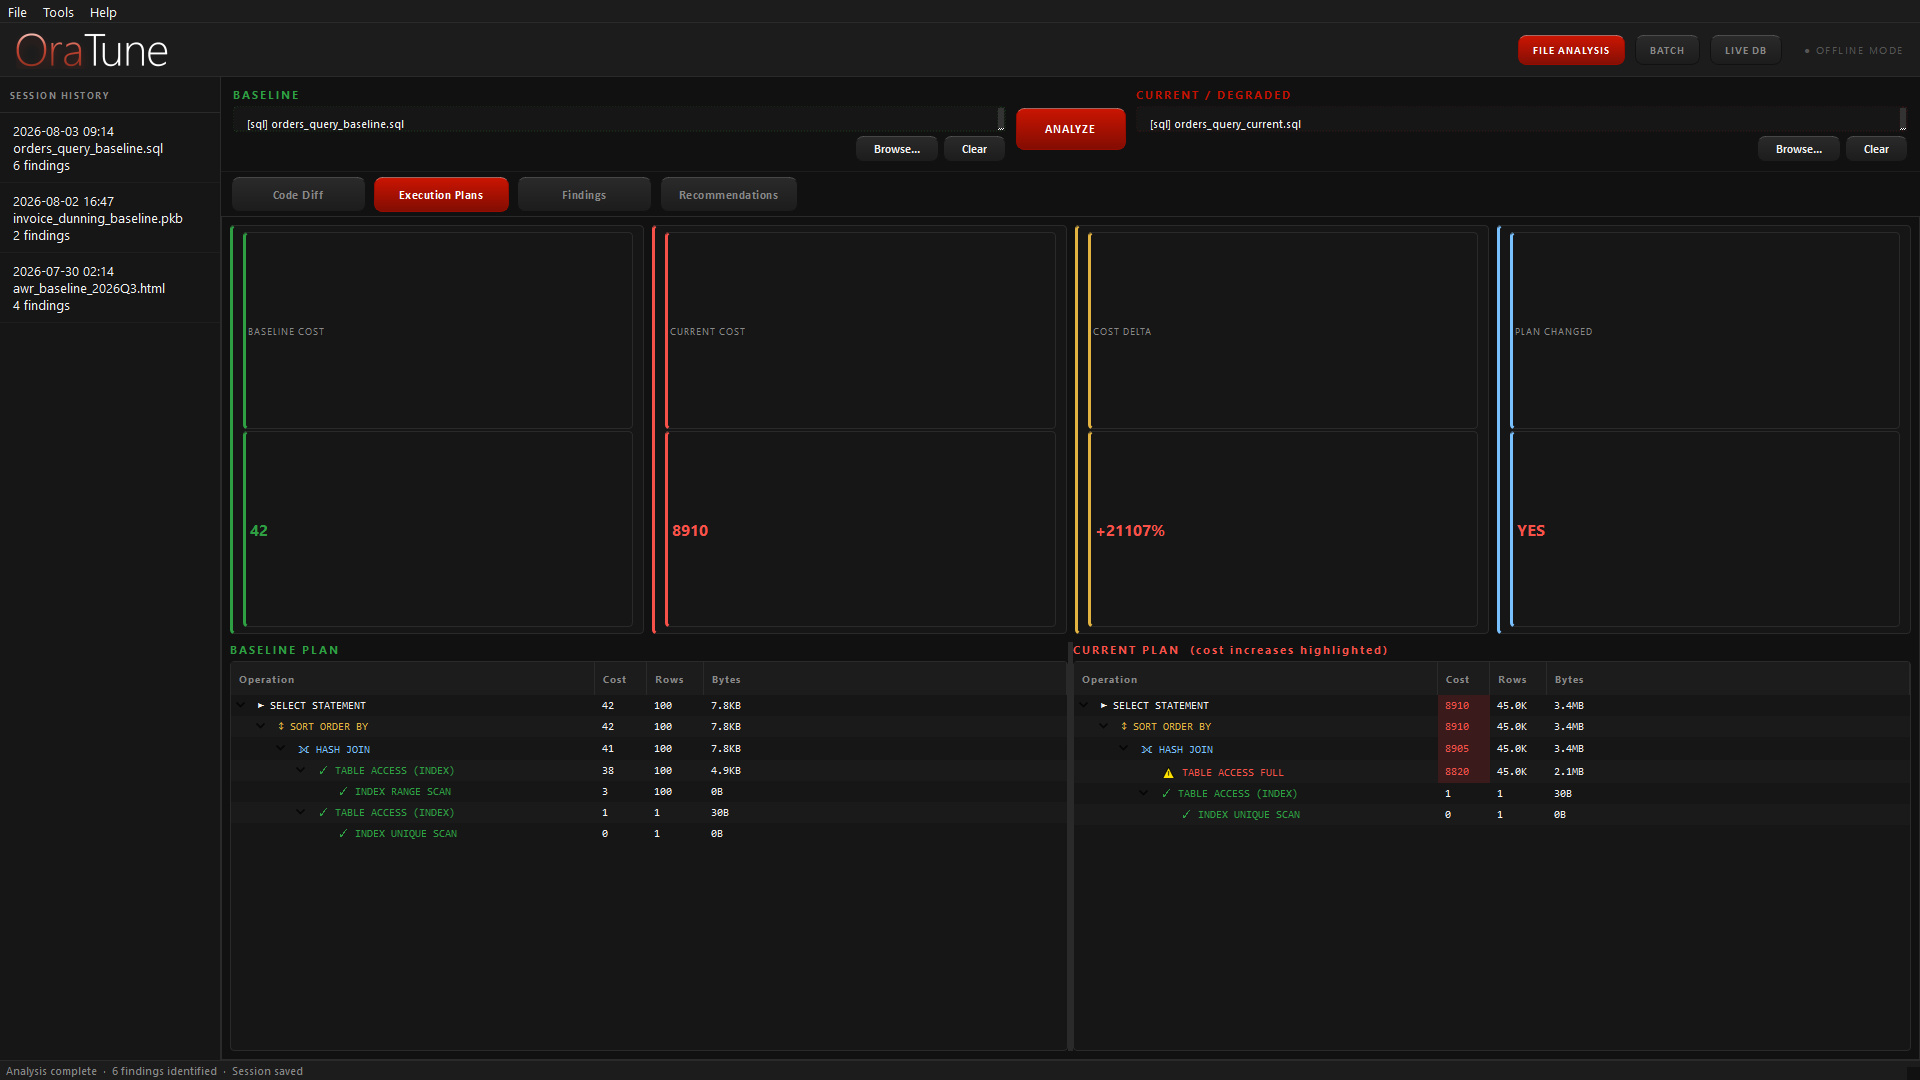
Operation-by-operation plan diff with cost and cardinality analysis. Full-scan regressions are flagged, not buried.

Parses DBMS_XPLAN output and walks the two plan trees node by node, with cost and cardinality shown at each. It surfaces full-scan regressions — an operation that flipped from an index scan to a full table scan — along with index changes, join-method changes such as nested loops to hash join, and new sort operations. A total-cost delta and a plan-shape-changed flag tell you at a glance whether the optimizer chose a different shape.

OraTune Execution Plans view: baseline cost 42 against current cost 8910, with a full table scan flagged in the current plan.

Index Change Detection

Indexes that appeared, disappeared, changed access method, or degraded in clustering factor.

From the plan comparison it isolates every index that appeared, disappeared, or changed access method between the runs. From SQLT dumps it also catches clustering-factor degradation, flagged high past a 50 percent drop — one of the quieter reasons a plan goes sideways after a data load.

OraTune Code Diff view: two versions of a SQL statement shown side by side.

AWR / TKPROF Analysis

Key metrics, wait events, and top SQL extracted and compared across both reports.

Parses AWR reports in text or Enterprise Manager HTML form, and TKPROF listings, from both the baseline and the current run. Key metrics, wait events, and top SQL are extracted and compared side by side, so a new wait event or a regressed metric lands as a ranked finding instead of a report you have to read end to end.

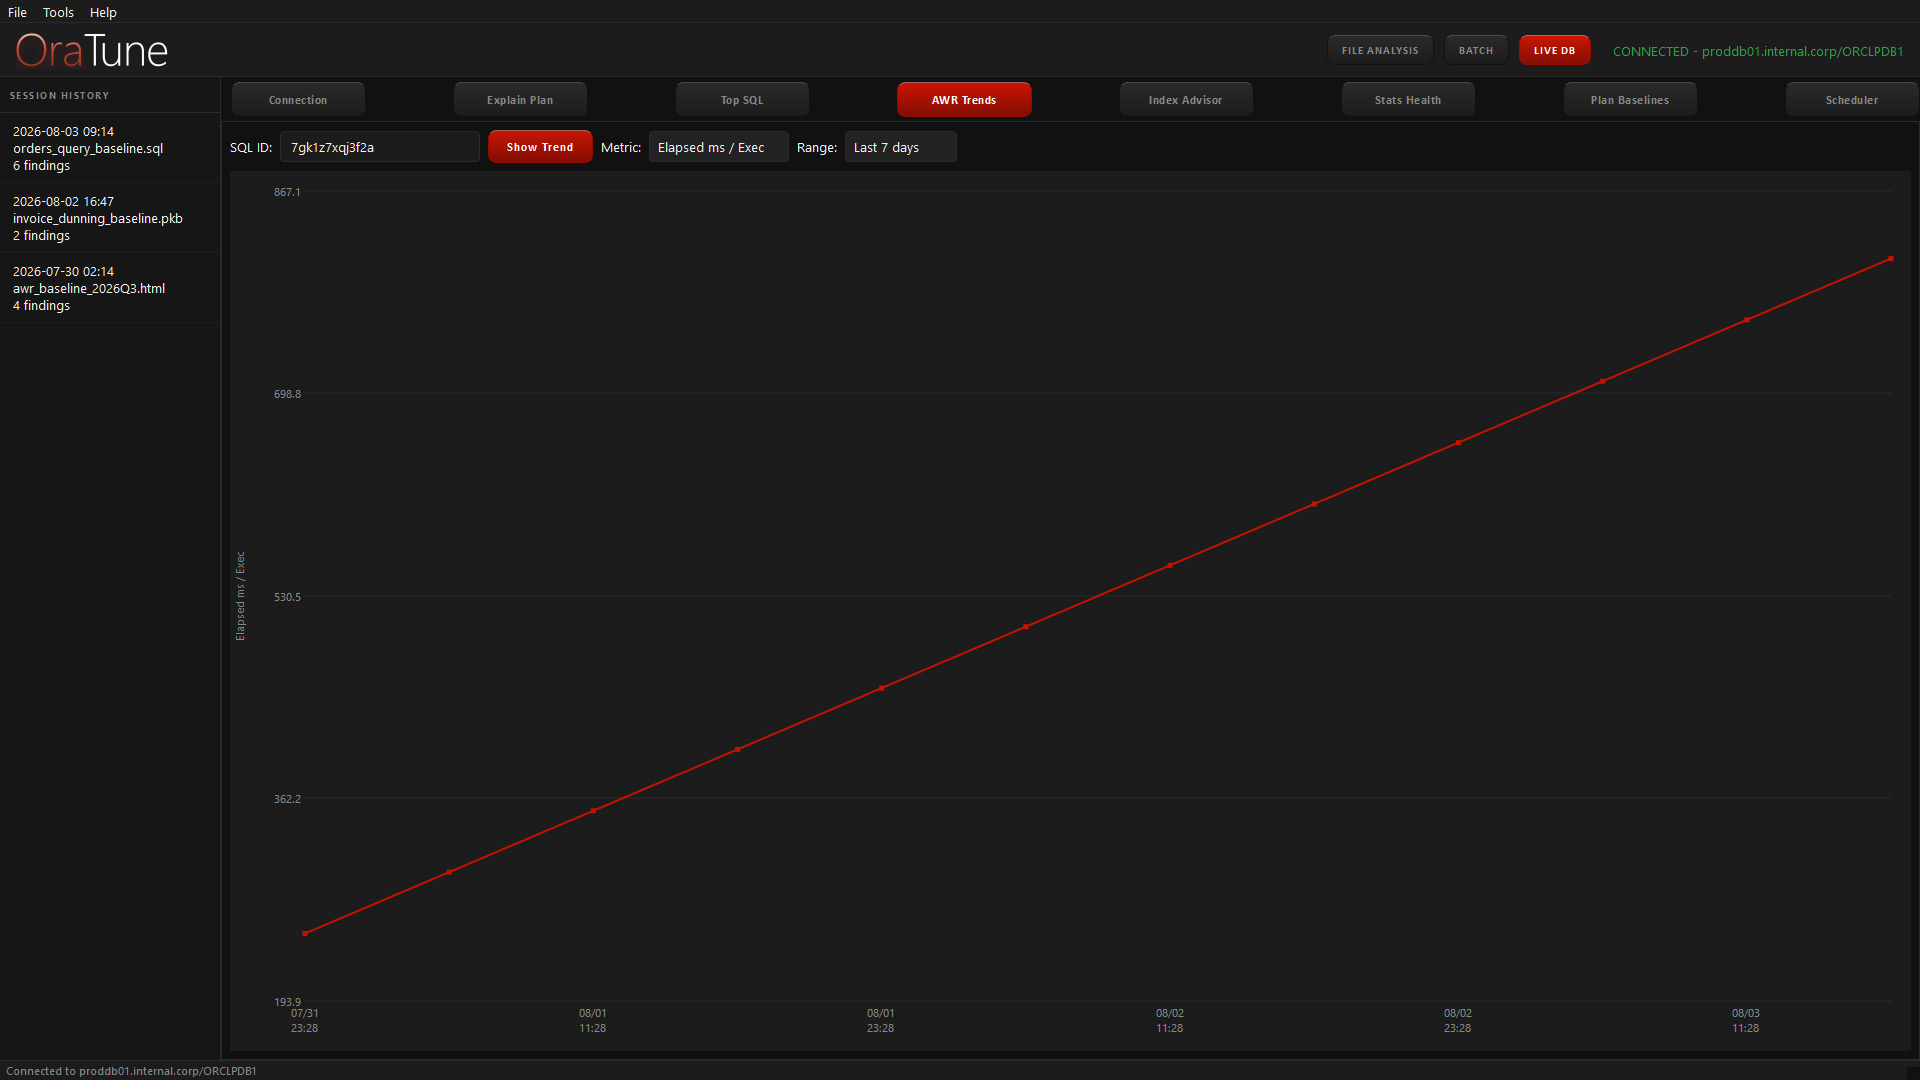
OraTune AWR Trends chart: a statement’s elapsed time per execution rising steadily over seven days.

Dump File Analysis

All four Oracle dump formats — Data Pump, ADR trace, SQL*Plus spool, SQLT — auto-detected and mined for evidence.

Auto-detects the format from its markers: Data Pump by binary magic bytes, ADR traces by SESSION ID and ORA- lines, SQL*Plus spools by text fallback, SQLT by its SQLTXPLAIN header. From each it pulls the evidence that matters — schema and object names from Data Pump; ORA- errors, wait events, and embedded plans from ADR traces; timing and autotrace stats from spools; optimizer parameters, table and index stats, clustering factors, and histograms from SQLT. Drifted parameters, degraded stats, and elapsed-time jumps of two times or worse are scored by severity.

OraTune Code Diff view: extracted SQL text compared between two runs.

Batch Analysis

Two folders in, one results table out. Every matched pair analyzed in sequence with per-pair drill-down.

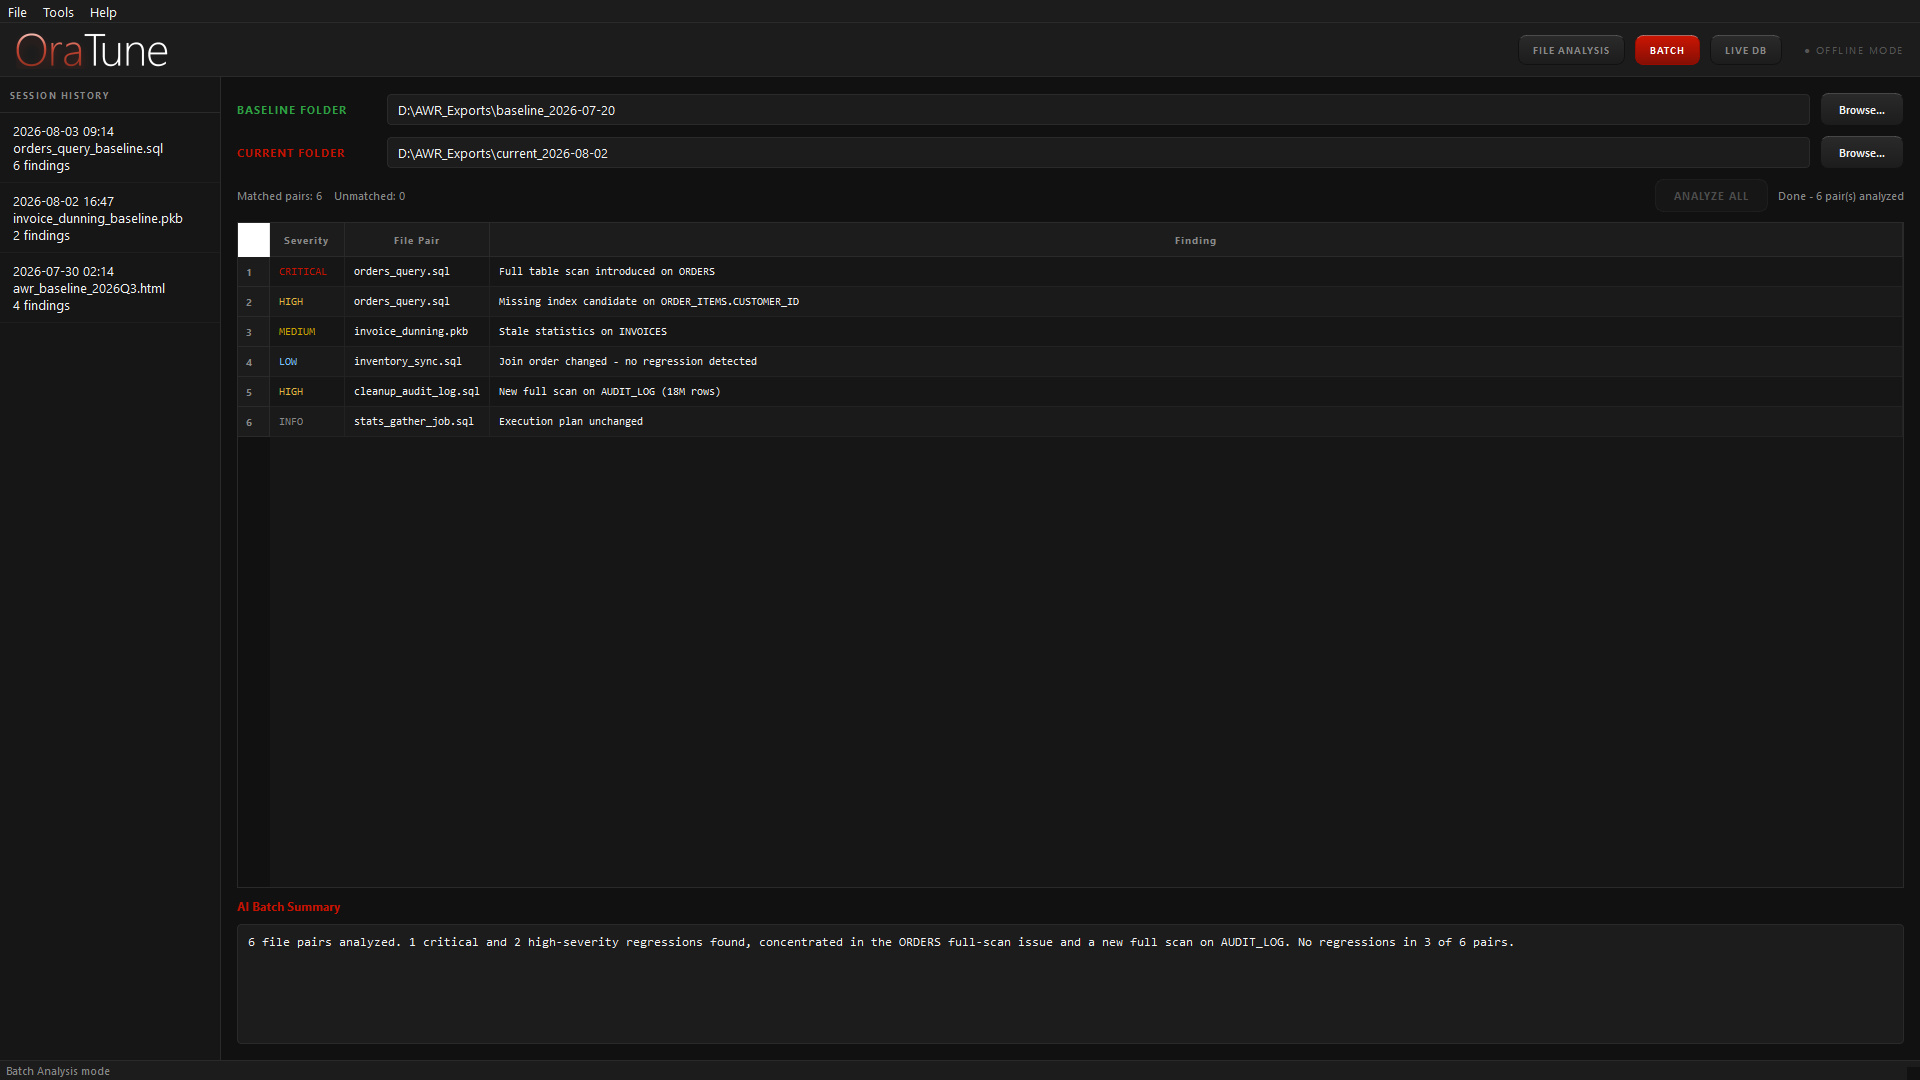
Point OraTune at a baseline folder and a current folder; files are matched by exact filename and each pair runs in sequence as the appropriate type, with a live progress counter. The results table shows one row per pair with its highest-severity finding — click a row for that pair's full findings log. Files present in only one folder are listed but skipped, and an AI summary closes the run when a provider is configured.

OraTune Batch Analysis view: a table of matched file pairs, each with its highest-severity finding.

Live DB mode

Connect to a running instance for instrument-grade diagnostics.

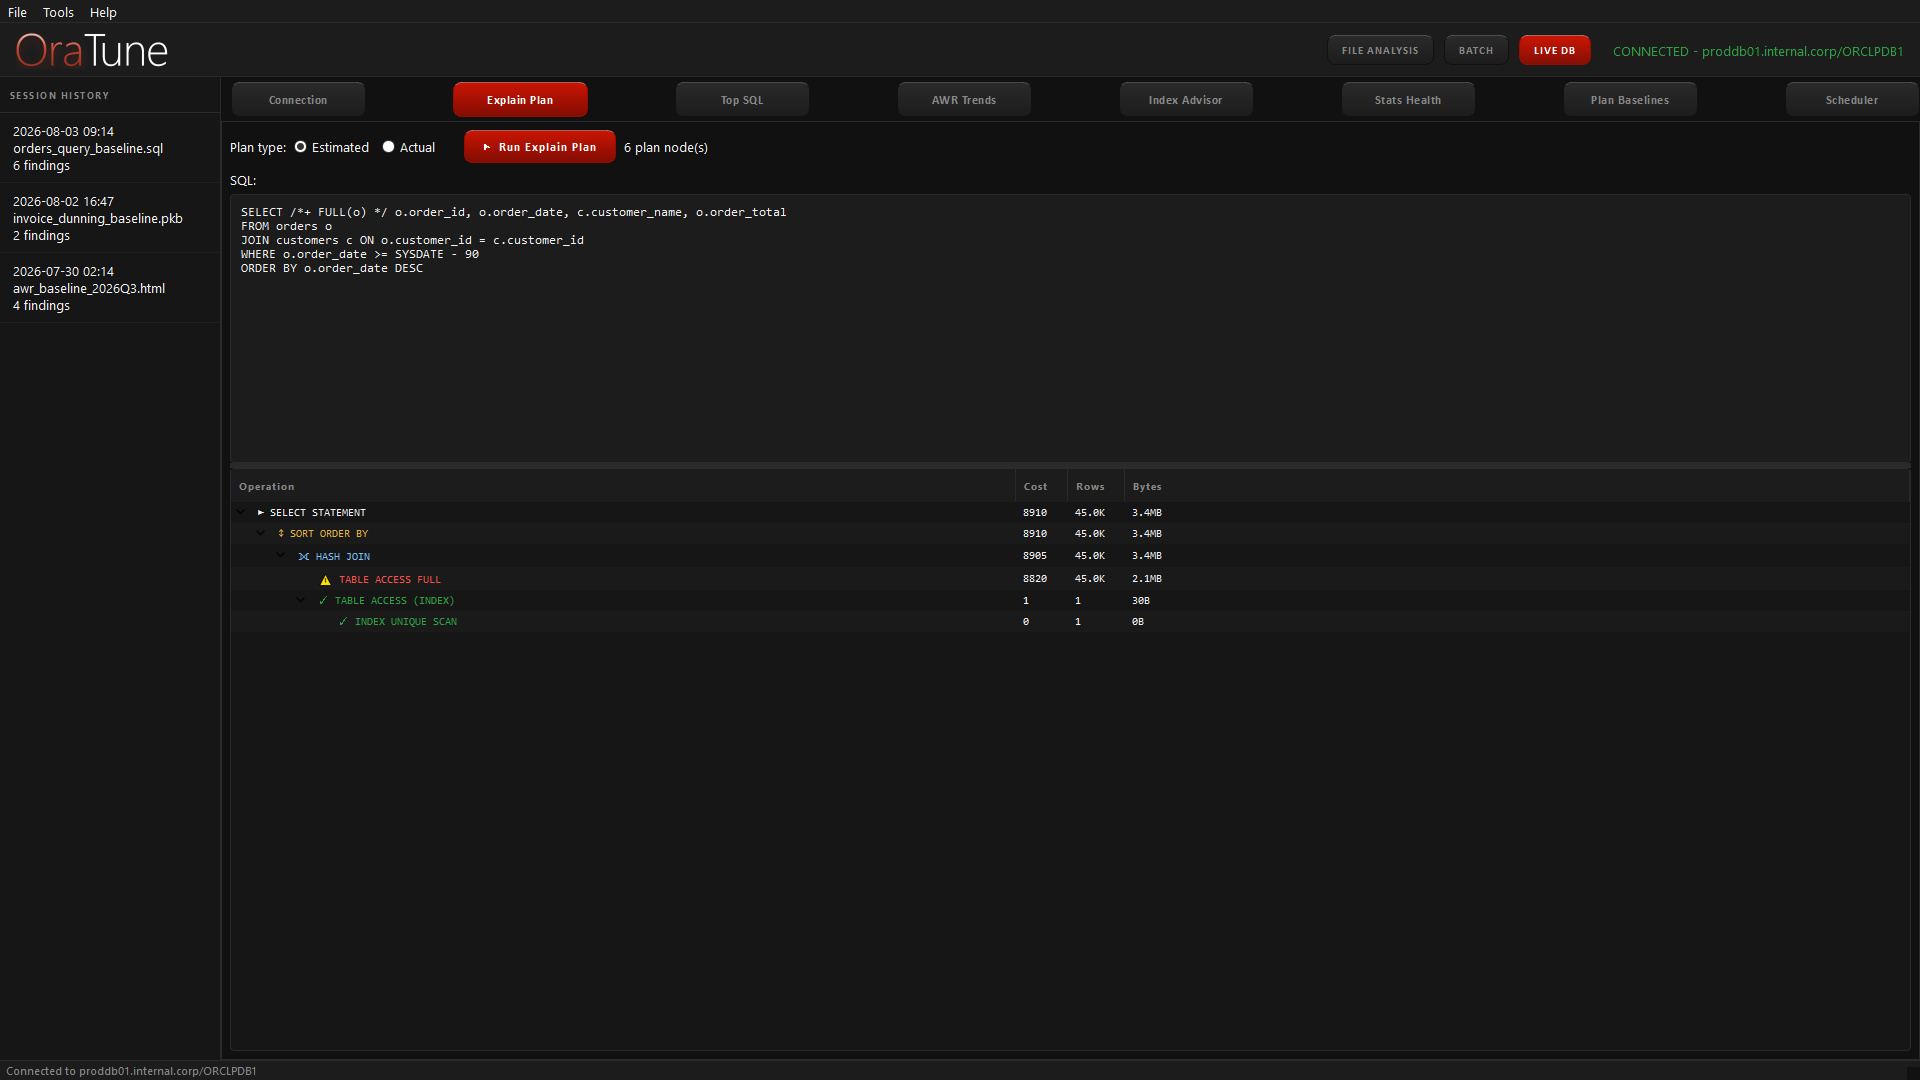
  • OraTune Explain Plan view: an execution plan tree with cost, rows, and bytes per operation.

    Explain Plan

    Estimated or actual execution plans for any statement — EXPLAIN PLAN via DBMS_XPLAN.DISPLAY, or a real run with gather_plan_statistics and DISPLAY_CURSOR — with bind variables auto-nulled so it plans without values.

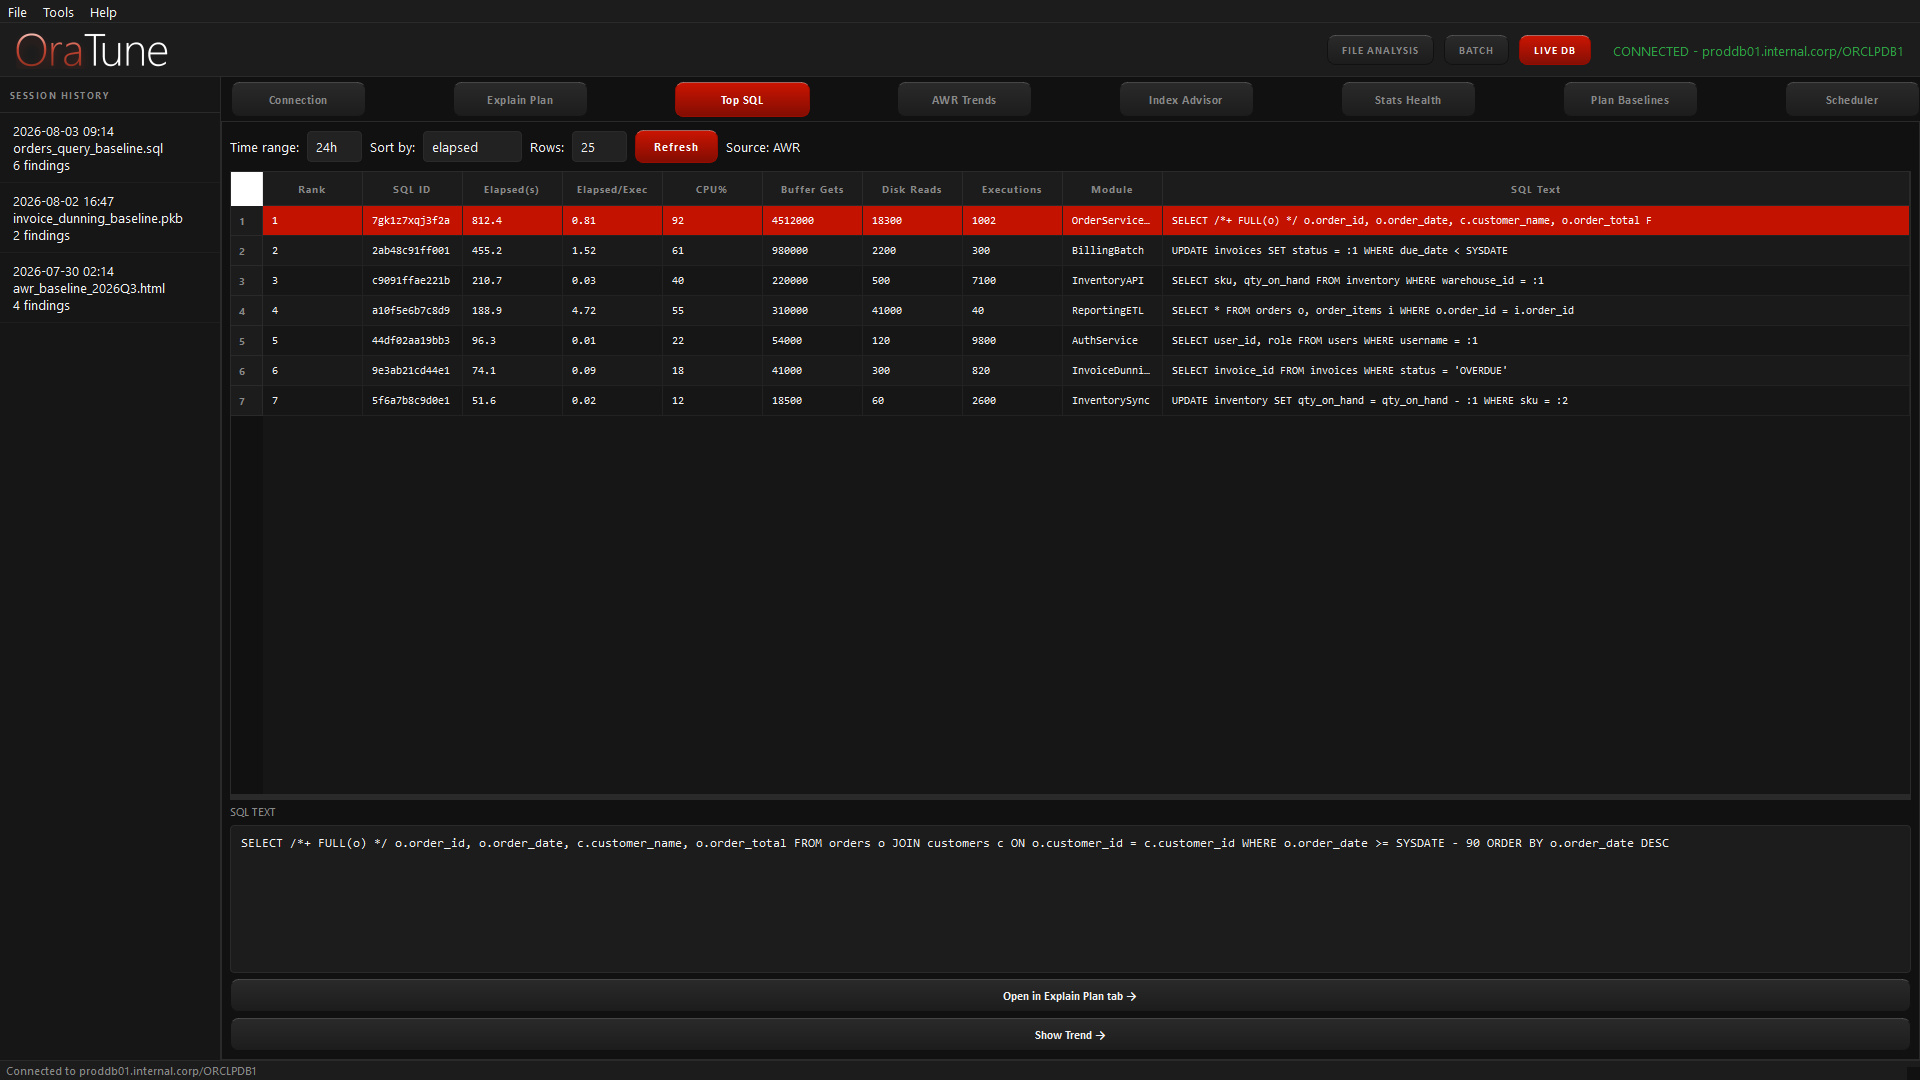
  • OraTune Top SQL view: statements ranked by elapsed time, CPU, buffer gets, and disk reads.

    Top SQL

    The top statements by elapsed time, CPU, buffer gets, disk reads, or executions, pulled from AWR history and falling back to V$SQL, with Oracle-internal SQL filtered out.

  • OraTune AWR Trends chart: per-execution metrics for one SQL_ID plotted over a date range.

    AWR Trends

    Per-execution metric trends for a single SQL_ID over a date range — elapsed time, CPU, buffer gets, disk reads, execution count — plotted from DBA_HIST_SQLSTAT.

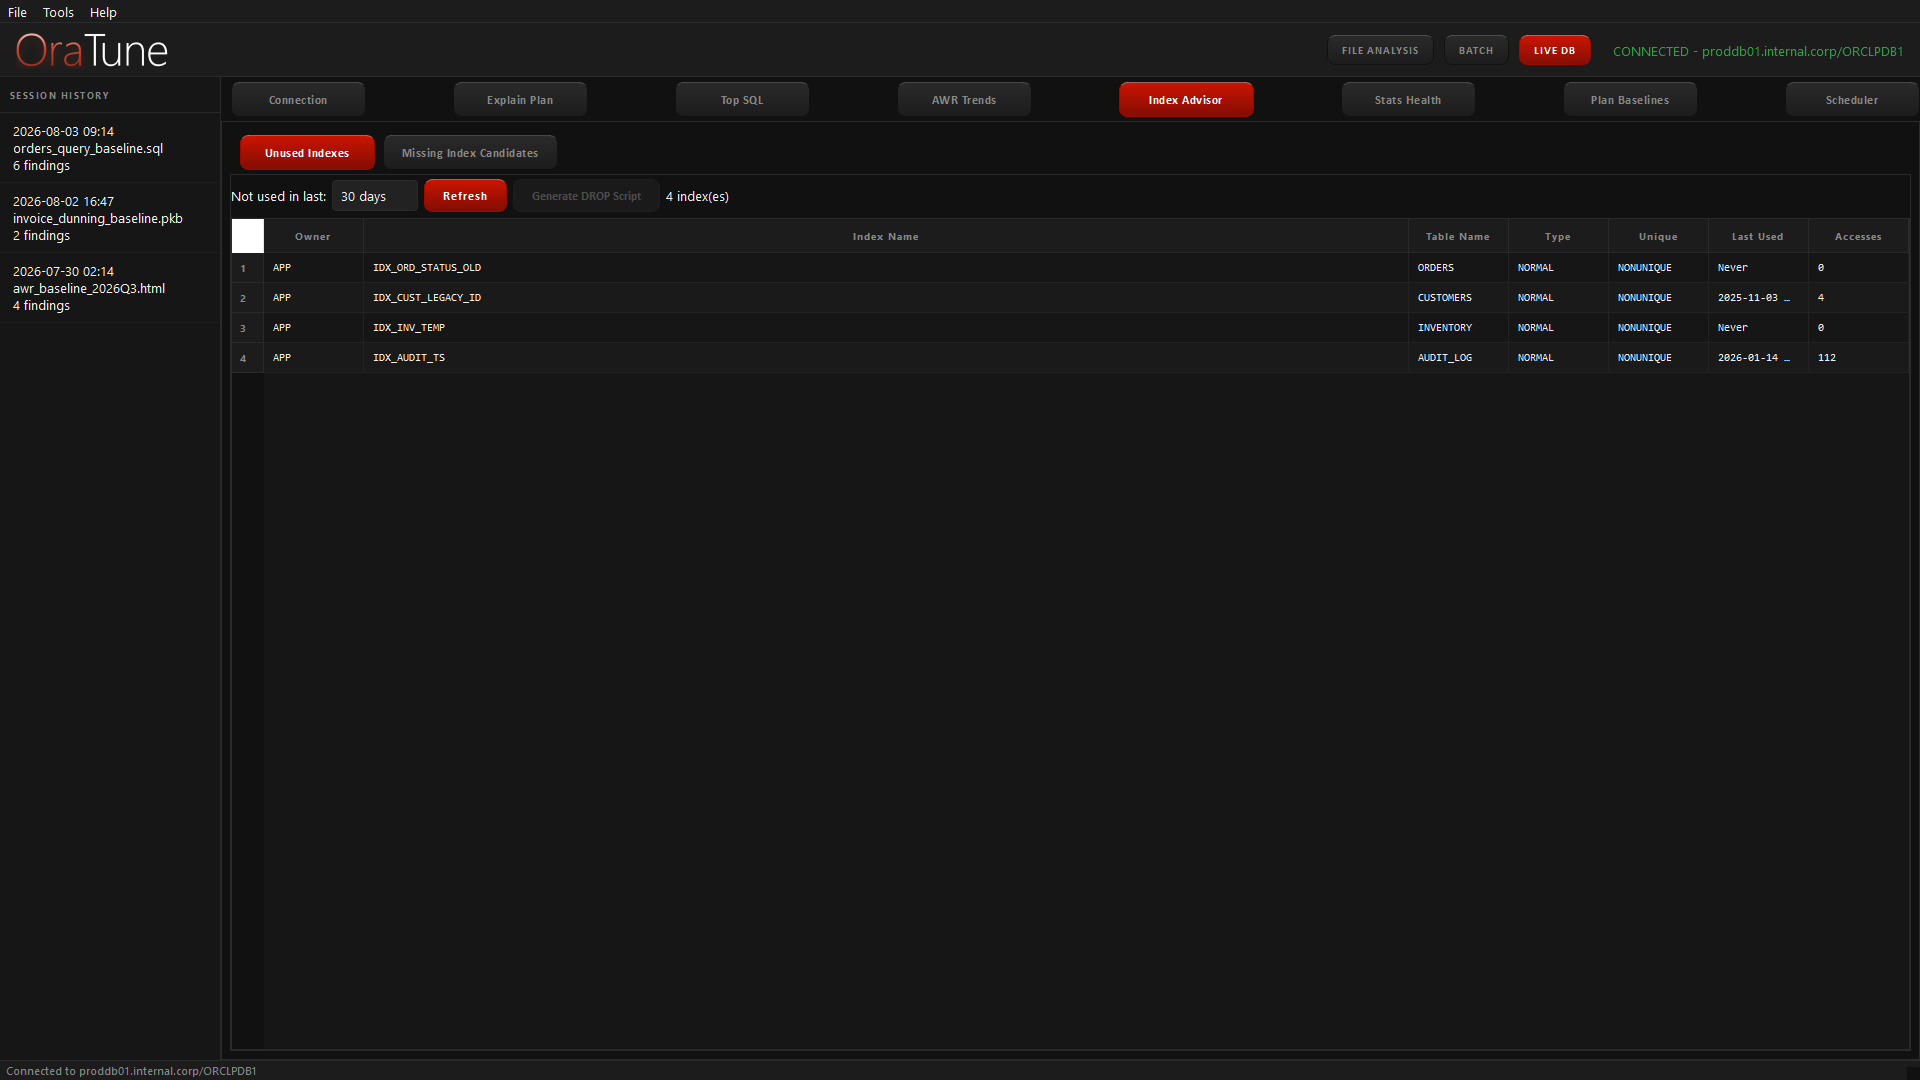
  • OraTune Index Advisor: a list of unused indexes with their table, type, and last-used date.

    Index Advisor

    Unused indexes not touched within a configurable window, and missing-index candidates: large tables doing full scans in AWR history, ranked by elapsed time.

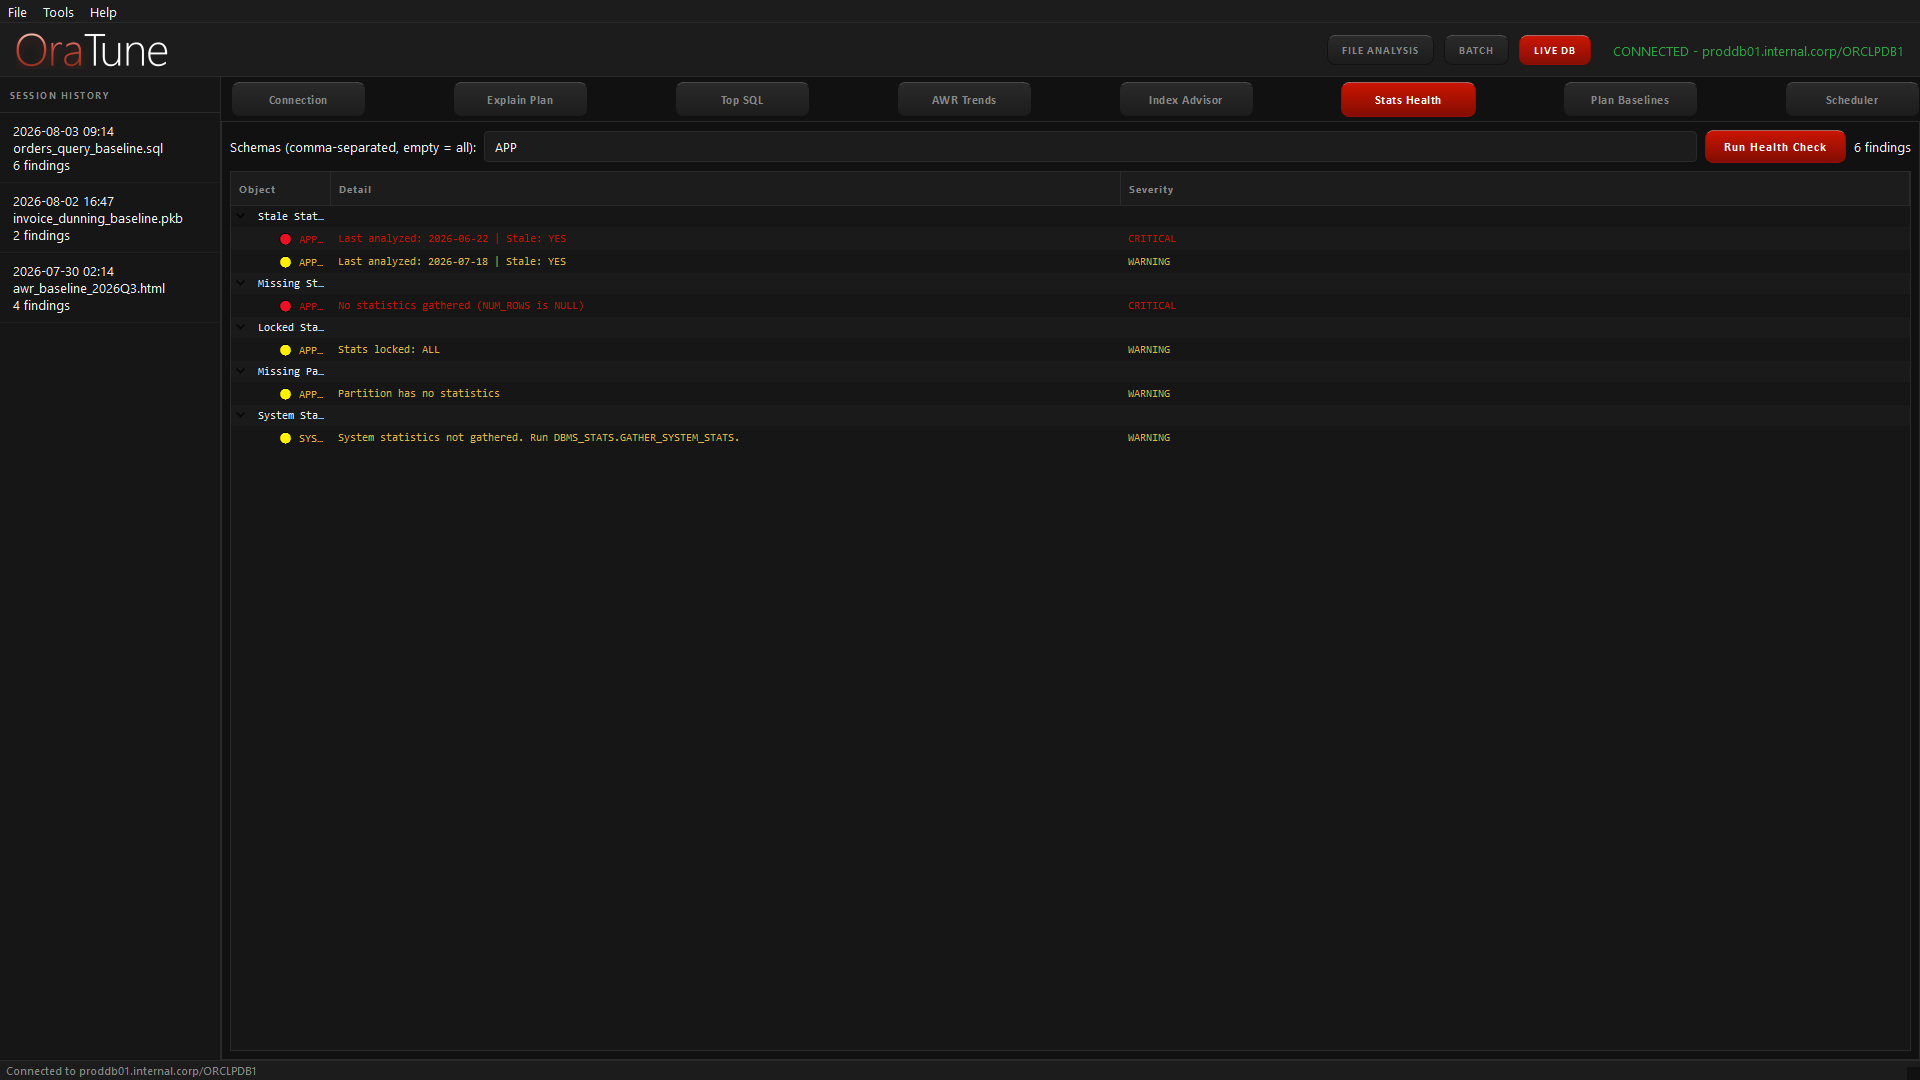
  • OraTune Stats Health view: optimizer-statistics issues grouped by check and severity.

    Stats Health

    Five optimizer-statistics checks — stale, missing, locked, un-analyzed partitions, and system stats — each surfaced with a severity and filterable by schema.

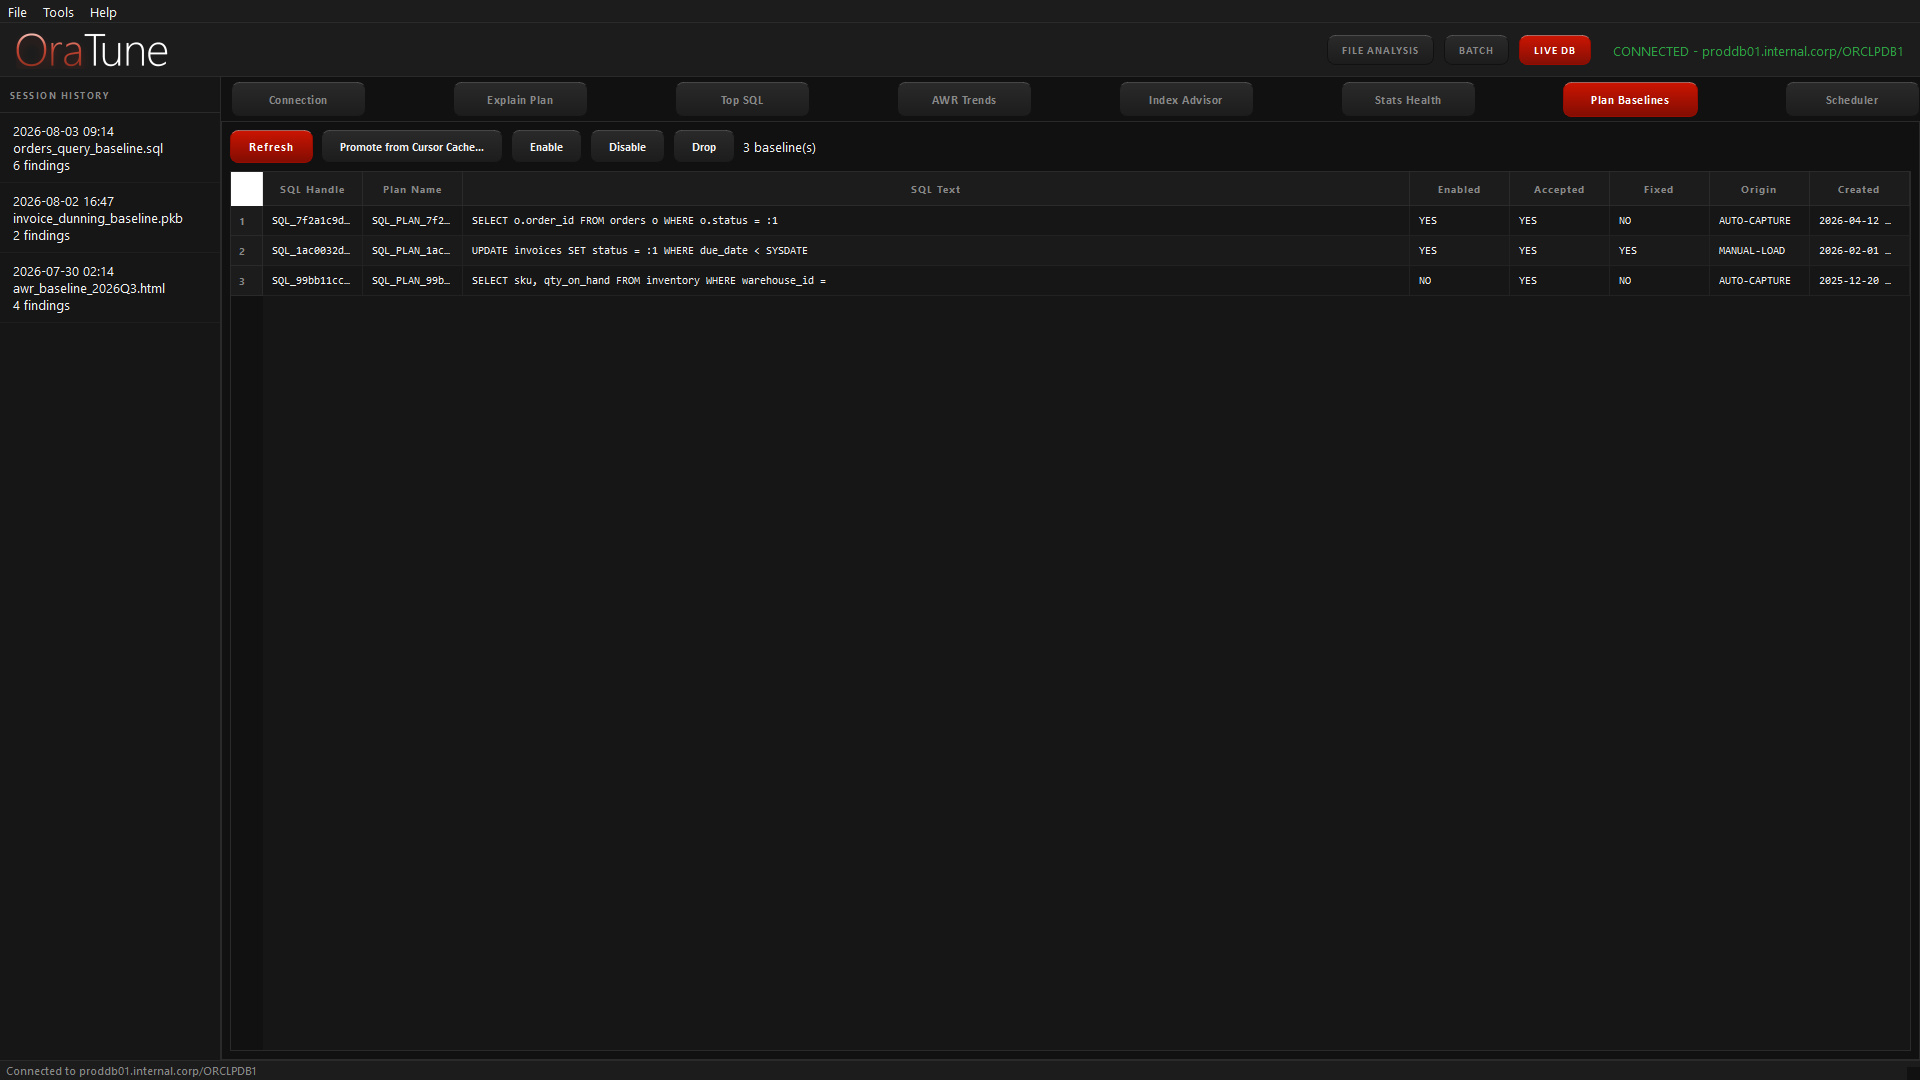
  • OraTune Plan Baselines view: SQL plan baselines with their enabled, accepted, and fixed status.

    Plan Baselines

    Browse SQL Plan Baselines and manage them in place: enable, disable, accept, fix, drop, or load a plan from the cursor cache via DBMS_SPM.

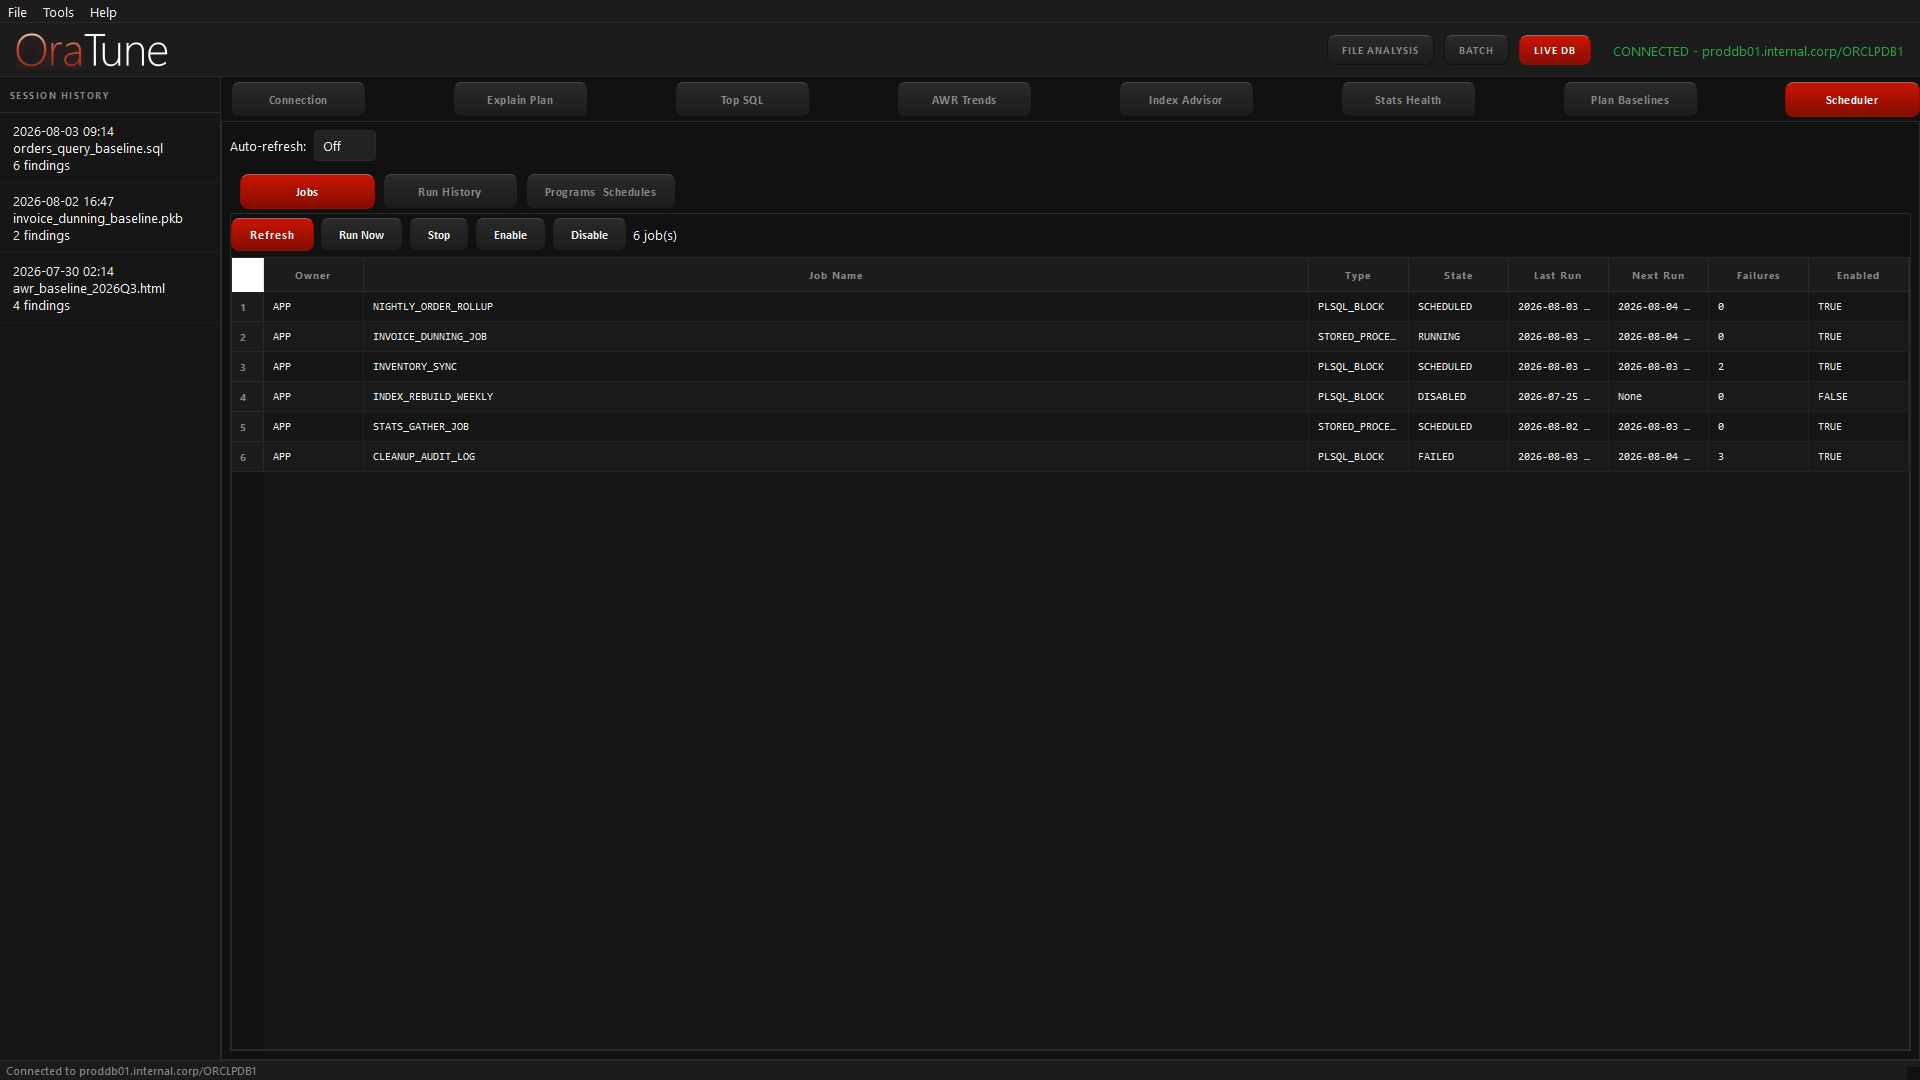
  • OraTune Scheduler view: DBMS_Scheduler jobs with their type, state, last run, and failure count.

    Scheduler

    Monitor DBMS_Scheduler jobs and their run history, and run, stop, enable, or disable a selected job without leaving OraTune.

AI when you want it. Rules when you don't.

The offline rules engine ships findings with Oracle-specific remediation on its own. Add a provider — Claude, OpenAI, Azure OpenAI, or GitHub Copilot — for root-cause narratives. Keys live in Windows Credential Manager, never in a file.

  • Claude
  • OpenAI
  • Azure OpenAI
  • GitHub Copilot
  • Offline rules engine